
Dagger2Metrics - measure performance of DI graph initialization
A couple months ago we went through possible issues with Dagger 2 - graph creation performance. Thanks to TraceView tool we can see exactly how much time is needed to initialize all requested dependencies. But it’s not easy - we have to find places in our code to start and stop measuring, dump results and analyze them in Android Studio. To make it bit easier, I’ve prepared simple library wich can help with catching potential performance issues.
Dagger2Metrics
Performance metrics library for Dagger 2 initialization process.
Description below is copied from Dagger2Metrics Github project site
If you use Dagger 2 for dependency injection in your Android app you probably know that it’s super optimized and non-reflection piece of code served by great engineers from Google (and formerly form Square).
Even with all those optimizations and fully generated non-dynamic code, still there are potential performance issues hidden in our code and all 3rd parties injected via Dagger 2.
The problem with performance is that it often decreases slowly so in day-by-day development it’s hard to notice that our app (or Activity or any other view) launches 50ms longer. And another 150ms, and another 100ms…
With Dagger2Metrics you will be able to see how much time was needed to initialize all requested dependencies (and dependencies of those dependencies).
Getting started
In your build.gradle:
In your Application class:
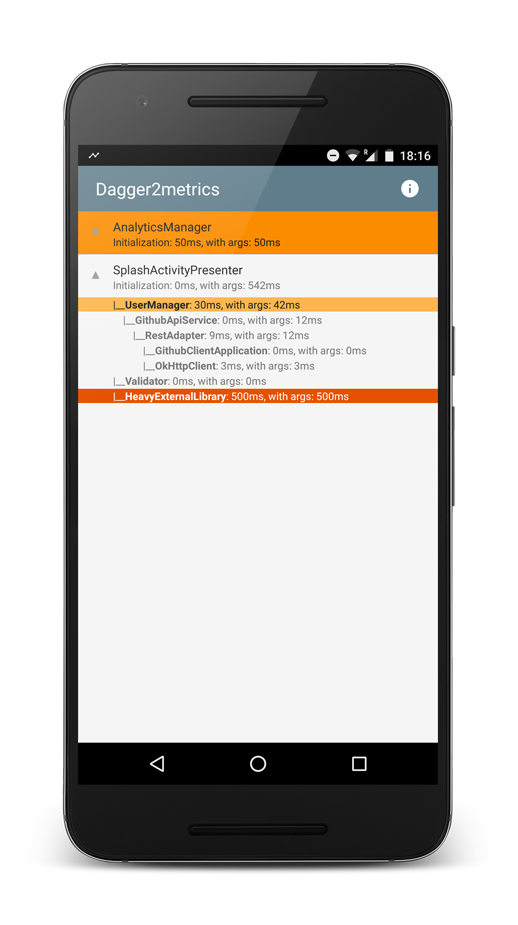
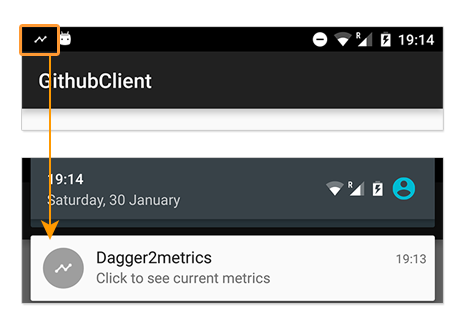
And that’s all. In your app you will see notification which opens simple summary of all finished initializations.
How does it work?
Dagger2Metrics captures all initializations from both - @Module -> @Provides annotated methods and @Inject annotated constructors.
In summary you will see the most-top injected dependencies with trees of their dependencies. Each of dependency shows how much time was needed to provide this object to Dagger 2 object graph (construction time itself and with all dependencies).
Why I don’t see all (sub) dependencies?
Metric trees don’t show dependencies which are already provided to Dagger’s graph, so only those constructed from scratch will be visible. Mainly because of readability and from a simple reason - we don’t want to measure Dagger 2 performance which in most cases won’t be an issue. We should be sure that our code provides requested dependencies as fast as it’s possible.
Customizing
Dagger2Metrics has three default levels of warnings:
You can adjust them to your needs.
Example app
You can check GithubClient project - example Android app which shows how to use Dagger 2. Most recent version uses Dagger2Metrics in its dabug build.
More about Dagger 2
If you’re just starting with Dagger 2, here is the list of resources which can help you:
GithubClient - example of Github API client implemented on top of Dagger 2 DI framework.
Blog posts:
- Dagger 1 to 2 migration process
- Introdution to Dependency Injection
- Dagger 2 API
- Dagger 2 - custom scopes
- Dagger 2 - graph creation performance
Source code
Source code of Dagger2Metrics is available on Github project site.
Author
Miroslaw Stanek
Head of Mobile Development @ Azimo Money Transfer
If you liked this post, you can share it with your followers or follow me on Twitter!