AndroidDevMetrics - Activity lifecycle methods tracing
AndroidDevMetrics is a performance metrics library which will help you find potential performance issues in your Android app. Thanks to it we are able to measure objects graph initialization in Dagger 2, Activities lifecycle methods timings and frame drops for each screen in app.
Since today another new feature comes to light. Without any additions in app’s source code AndroidDevMetrics lets us profile Activity lifecycle calls (onCreate(), onStart(), onResume()) with method tracing.
Methods tracing
Android itself gives us possibility to trace methods execution stack. Thanks to this we are able to get know how much time was needed to run each method (exclusively and inclusively - with all methods called inside this particular method).
We have two ways to start profiling:
- Easier, less accurate directly form Android Studio. Accessed via Android Monitor tab -> CPU -> Start/Stop Method Tracing can be started and stopped by hand. Immediately after that Traceview debugger is opened with collected data. While this way is probably the easiest, in most cases it’s hard to hit start/stop in a moment which we want to measure.
- A bit more complex but extremely accurate - profiling directly from source code. Android SDK provides us Debug class which has two methods:
startMethodTracing()andstopMethodTracing(). Wrapping our code with them will give us very clear results. Trace file is saved in device’s storage so we can get it by calling$ adb pull {file_path}.trace. To see this file you have to just drag it to Android Studio. If you have used this method before, probably you know that there is one big disadvantage ofDebug.startMethodTracing()- our code has to be recompiled and pushed to our device every time when we want to debug something new. So in more complex projects it takes ages (tens of seconds or minutes…)
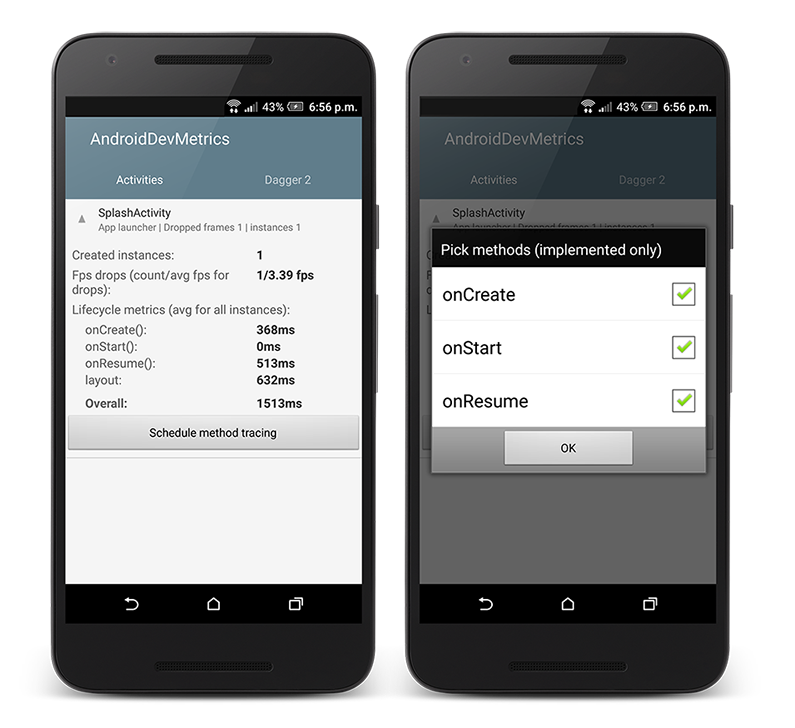
With a newest version of AndroidDevMetrics (v0.4) you can schedule method tracing for Activity lifecycle methods: onCreate(), onStart(), onStop().

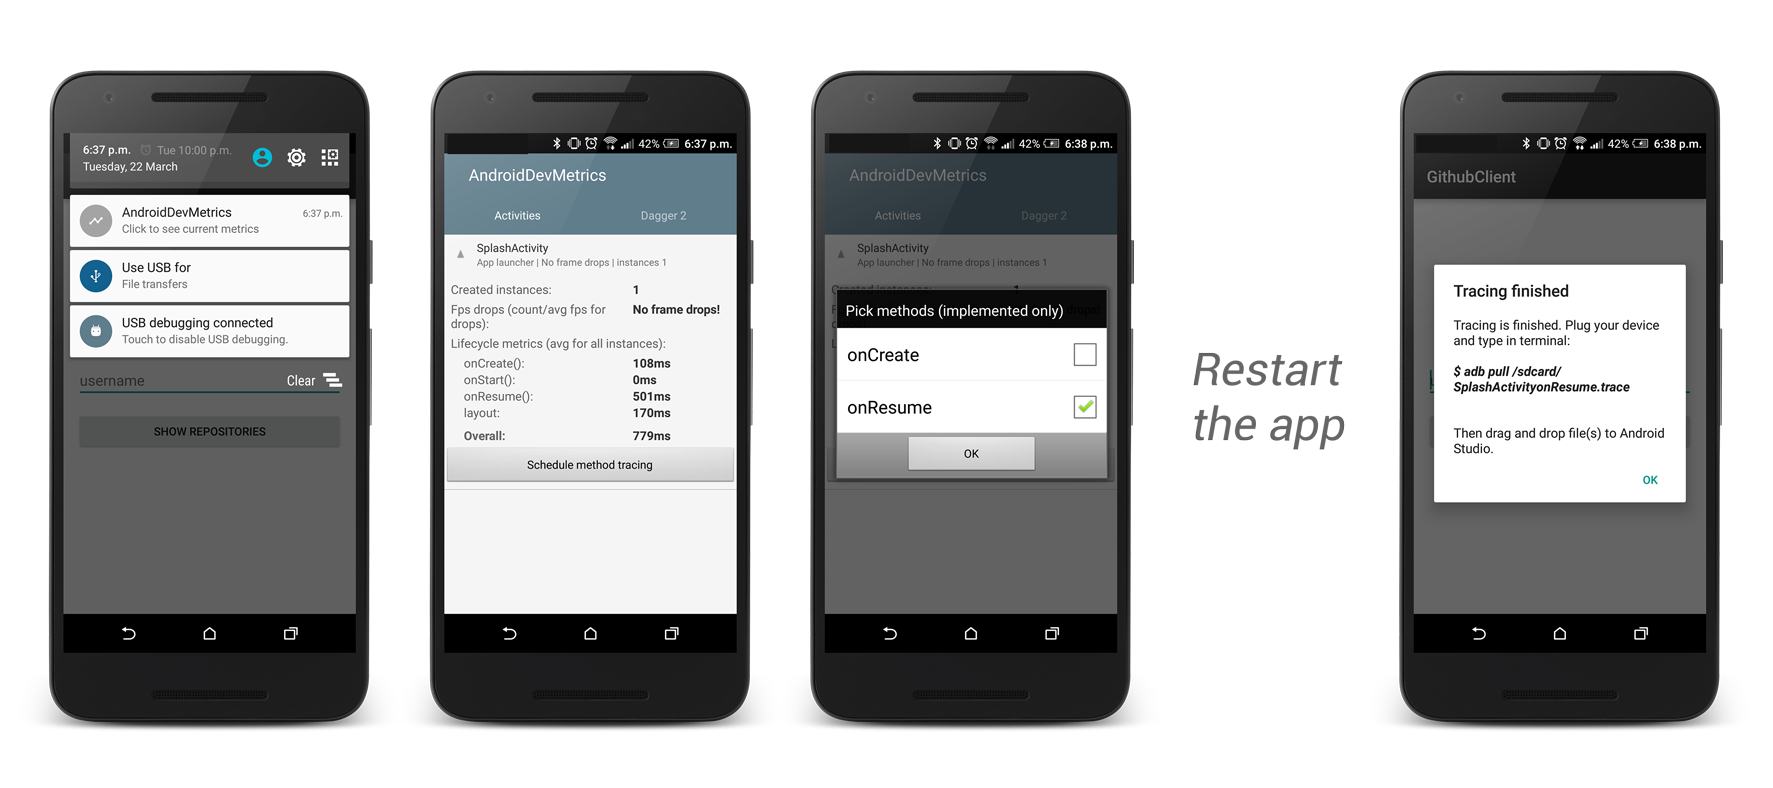
Profilling will take a place in the next Activity launch. You can even kill your app and open it again. In this case you will make sure that profiled Activities are created from a scratch.
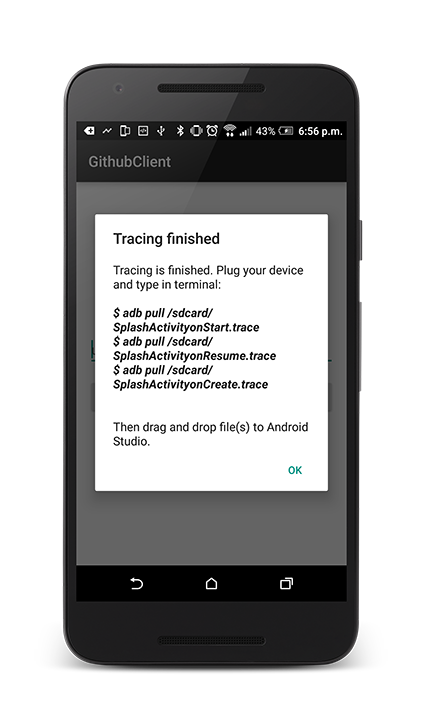
What next ? If everything will be ok you should see Dialog telling you how to grab generated .tracef files from your device. And then all you have to do is just to drag those files to Android Studio to see them.

TraceView
How it works in practice? Let’s assume that in our Activity we have this piece of code:
As you can see, in onResume() app calls two methods. The 2nd one simulate any heavy operation which takes 500ms. Let’s profile it with AndroidDevMetrics:

Here you can see how TraceView looks like for capture file: SplashActivityonResume.trace

We can see clearly that most of the time is taken by SplashActivity.callHeavyMethod(). It takes about 500ms inclusive time (why only 32µs of exclusive time? Because most of it is taken by Thread.sleep() called inside this method).
Simple, right? I hope that thanks to this update we will save a lot of time which we would spend on recompiling the app code. 🙂 Now it’s your turn - let’s give a chance to AndroidDevMetrics. I would really appreciate your feedback!
Thank you for reading.
Source code
Full source code of AndroidDevMetrics project is available on Github repository.
Getting started with AndroidDevMetrics
Script below shows how to enable all available metrics.
In your build.gradle:
In your Application class:
Author
Miroslaw Stanek
Head of Mobile Development @ Azimo Money Transfer
If you liked this post, you can share it with your followers or follow me on Twitter!