FlatBuffers performance in Android - allocation tracking
After my last post about parsing JSON in Android with FlatBuffers parser (implemented in C++, connected via NDK to our project) great discussions started about the real performance of FlatBuffers and comparising them to another serialization solutions. You can find those debates on Reddit or in comments section on Jessie Willson’s blog.
I won’t delve into them but the conclusions are very bright. FlatBuffers are not a silver bullet (like any other solution!), they shouldn’t be directly compared, especially with object serializers. But still they are fast. Built on top of byte[] array can beat any Object-based solution.
That’s why in this post we’ll take a look at some performance metrics. While byte[] array is lightweight datastore, represented data is not in the final form. It means that somewhere later in our app we’ll have to spend some time on objects initialization. It could mean that FlatBuffers are not fast but they just delay allocations. And this is where we start - with memory allocation metrics.
Intro - Allocation Tracker
Allocation Tracker records an app’s memory allocations and lists allocated objects for the profiling cycle with there size, allocating code and call stack. Since Android Studio 1.3 release we can use it directly from our IDE to see how allocation looks like in short period of time in our app.
Full instruction how to use it (and description of other memory profilling tools) can be found in official Allocation Tracker documentation.
In very short version, to track your app’s memory allocation you have to:
- Run your app from Android Studio on connected device/emulator.
-
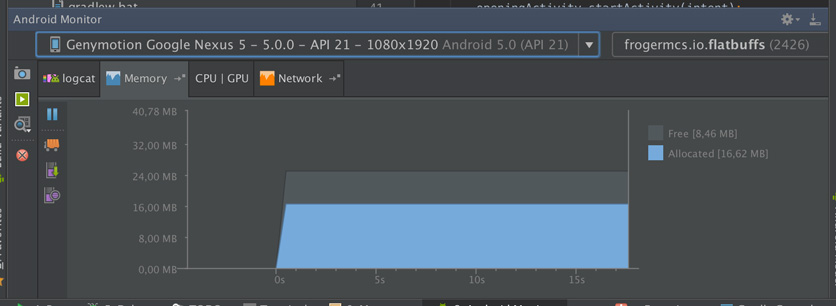
Open Android Monitor panel from the bottom of Android Studio window, on Memory tab.
-
You should see real time memory usage chart for your app. When you are ready to measure allocation, just press Start Allocation Tracking button on the left bottom corner of this view.
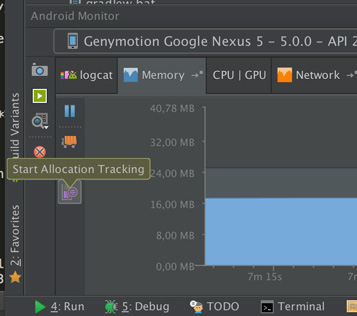
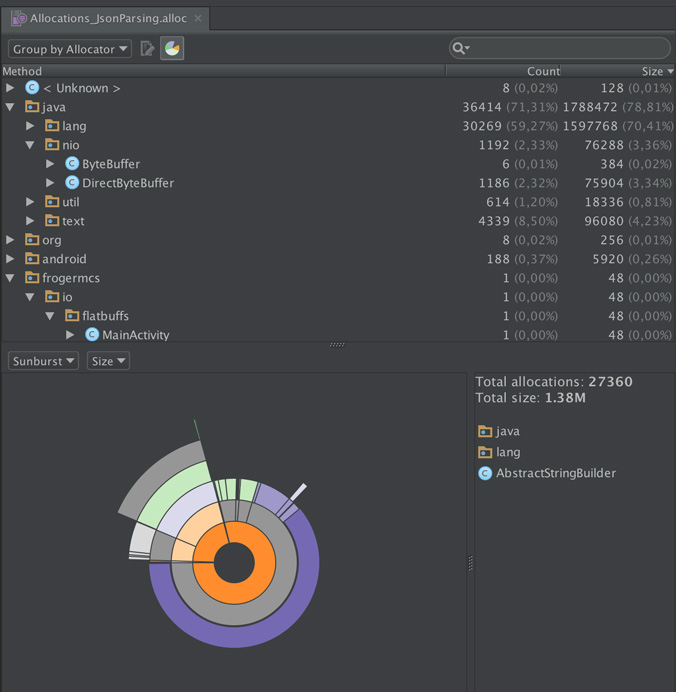
- When you press again (Stop Allocation Tracking), after short while you should see preview of recorded data (
.allocfile). - Now you can customize this view by grouping call stack or showing allocation charts (linear or sunburst).
Prepare the app
For performance tests we’ll use our FlatBuffs app which was created in previous posts. We’ll add new screen - ReposListActivity which will show ListView with parsed repositories. It will use 3 adapters - one for Json parsed objects, two for FlatBuffers objects (optimized and non-optimized version).
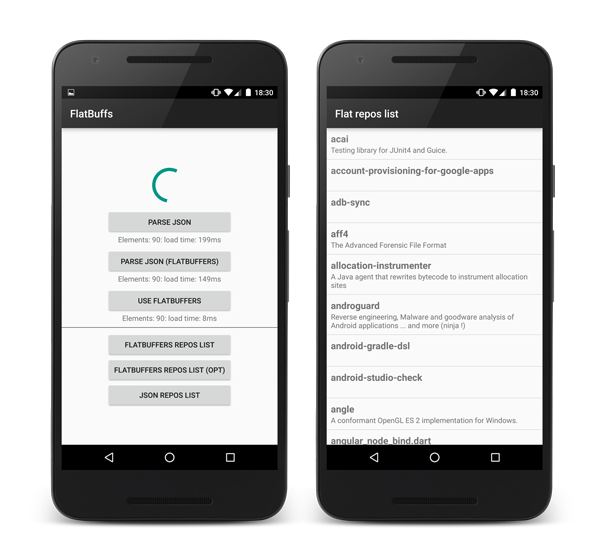
Updated source code is available on Github repository.
Memory Allocation Tracking
In this post we’ll try to measure how many memory allocations happen during some operations made on our JSON and FlatBuffers data. We’ll use prepared earlier data: JSON with repositories list and its representation converted to FlatBuffers.
Our files contain 90 entries with repositories and weight: Json - 478kB, FlatBuffers - 362kB (25% less in this particular case).
Parsing process
Probably for this process we should prepare another post which will describe it more detailed in all possible combinations. As was mentioned earlier Json parsing shouldn’t be compared in direct way with Flatbuffers. Why?
- Json parsing (via GSON for example) gives us way to convert String to Java objects. But not only this process is time consuming. We should also initialize our parser (configure fields mappers) which also takes time. Do we do it once? Or everytime when we need to convert Json to Java objects via
new Gson().fromJson();? - FlatBuffers can be handled in a couple different ways:
- Pure FlatBuffers format (bytes array comes from API for example). In this case actually there is no parsing. No object is created (except one big
byte[]array to store whole data stream). It means that instead of hundreds/thousands objects created by Json parser we make only one allocation. But! Pure bytes array in most cases gives us nothing. Somewhere later we have to extract at least part of byte array data and convert it to real Java object. It can be problematic for example in ListViews. We’ll see this case later in this post. - Json to FlatBuffers parsing. In this case we need to use our NDK FlatBuffers parser which will convert JSON string to FlatBuffers bytes array. In this case objects are created in both Native and Java heap and comparison to pure Java parser won’t be obvious.
- Pure FlatBuffers format (bytes array comes from API for example). In this case actually there is no parsing. No object is created (except one big
But hey, from pure curiosity we’ll take a look at Allocation Tracker anyway.
Json parsing
Measured code:
String reposStr contains repos_json.json content.
Results
Allocations_JsonParsing.alloc this file can be opened in Android Studio.
Allocation chart:
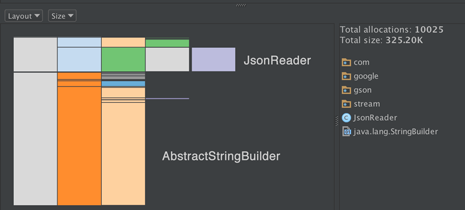
Memory allocated in measured time: 2.27M, total allocations: 51066.
- AbstractStringBuilder: 60% (1.38M), 27360 allocations
- JsonReader: 14% (326K), 10025 allocations
It means that ~500kB JSON allocated about 1.5M of memory (mostly by transient objects).
FlatBuffers parsing
Measured code:
bytes contains repos_json.flat content.
Results
Allocations_FlatBuffersParsing.alloc this file can be opened in Android Studio.
Allocation chart:
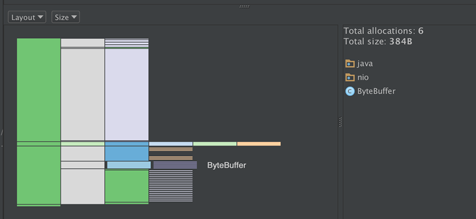
Memory allocated in measured time: 8.56K (yes, it’s 290x less), total allocations: 251.
- ByteBuffer: 4.5% (384B), 6 allocations
- ReposList: 1 allocation
It means that almost nothing was done to provide FlatBuffers data to our app. But wait, where is our 362K file? Memory was allocated earlier, in a moment of reading repos_flat.bin file from raw resources - in RawDataReader.loadBytes() method (see source).
Passing data between Activties via Intent bundle
Test case:
Allocation tracker is started just before creating intent and starting acitvity. Stopped after activity is opened, and ListView is presented.
Json objects
To make this test possible, models: RepoListJson, RepoJson, UserJson implemented Parcelable interface. Code was generated by ParcelableGenerator plugin in Android Studio.
Measured code (+ code called in a moment of transition between Activities) :
Results
Allocations_JsonObject_IntentBundle.alloc - this file can be opened in Android Studio.
Allocation chart:
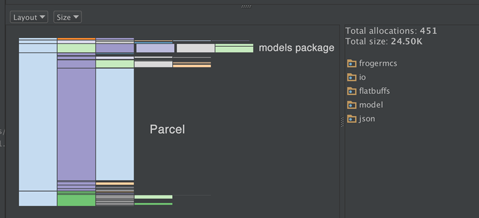
Memory allocated in measured time: 454.90K, total allocations: 7539.
- Parcel: 66.6% (303.54K), 5009 allocations
- frogermcs.io.flatbuffs.model.json.* package (all models): 5.38% (24.56K), 452 allocations.
FlatBuffers objects
Measured code (+ code called in a moment of transition between Activities) :
Results
Allocations_FlatBuffers_IntentBundle.alloc - this file can be opened in Android Studio.
Allocation chart:
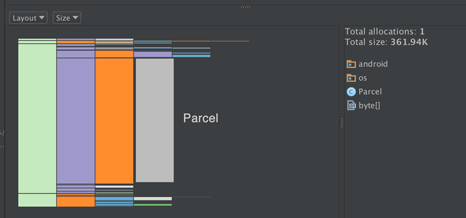
Memory allocated in measured time: 491.25K, total allocations: 2149.
- Parcel (mainly byte[]): 73.68% (361.94K), 1 allocation (it’s clearly our FlatBuffers bytes array)
- ReposList: 1 allocation.
While allocated memory size is very similar (455K JSON vs 491K FlatBuffers) we can see much less allocations in FlatBuffers usage. Again we needed only 1 allocation for whole bytes buffer and another 1 for our root object.
Displaying data in ListView (while scrolling)
This can be the most interesting. As it was mentioned FlatBuffers format moves objects allocation process from parsing to usage time. It can be damaging for our app smoothness, especially when this data has to be continuously processed. But used wisely it doesn’t have to be.
Test case:
ReposListAcitvity is opened and we can see list of first repositories. Allocation Tracker measures scrolling process (from first to last element, by 1 fling gesture).
Here is measured getView() method which will be called tens of times in scrolling process (it looks simillar on all adapters):
Of course most interesting code for us is:
Json objects
Measured code (ViewHolder class):
It’s pretty straightforward - name and description strings are just passed to TextViews.
Results
Allocations_JsonObjects_List.alloc - this file can be opened in Android Studio.
Allocation chart:
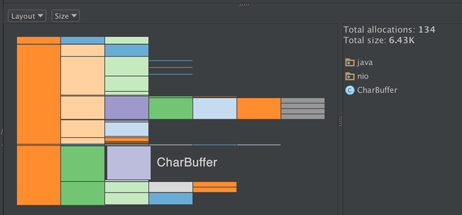
Memory allocated in measured time: 32.18K, total allocations: 523.
- CharBuffer: 6.43K (19.99%), 134 allocations
- JsonRepositoriesListAdapter$RepositoryHolder: 2 allocations
Only those two classes are interesting. The rest of measured objects are common for JSON and FlatBuffers adapters.
FlatBuffers objects
Measured code (ViewHolder class):
The same like in JSON ViewHolder, except name and description are not String fields, but methods.
Results
Allocations_FlatBuffers_List.alloc - this file can be opened in Android Studio.
Allocation chart:
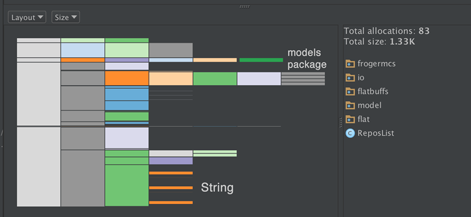
Memory allocated in measured time: 50.66K, total allocations: 892. Whoa! It’s about 40% more in just one fling gesture!
- CharBuffer: 6.43K (12.70%), 134 allocations
- String: 12.48K (15.70%), 140 allocations Those allocations don’t occur in JSON objects ListView
- frogermcs.io.flatbuffs.model.flat.* package (all models): 9.30% (1.33K), 83 allocations.
And this is interesting. CharBuffer objects allocations number stay unchanged. This is because those objects are created by TextView, in setText() method (just dig deeper in Android source code).
But it seems that our adapter created at least 140 new String objects and about 80 Repo objects which didn’t have to be created in JSON ViewHolder. What was happened?
Just go back to FlatBuffers documentation for a while:
Note that whenever you access a new object like in the pos example above, a new temporary accessor object gets created.
In short it means that everytime when we call reposList.repos(position) new Repo object is created. What about strings?
The default string accessor (e.g. monster.name()) currently always create a new Java String when accessed, since FlatBuffer’s UTF-8 strings can’t be used in-place by String.
The same - repository.name() and repository.description() create new Strings everytime we call for them.
And this is why FlatBuffers can be dangerous for our app smoothness. Everytime when we do scroll (or something what calls onDraw() method) new objects are created. Finally it will cause GC event somewhere in scrolling process.
Does it mean that we’ve just found inexcusable issue? Not at all.
Don’t drop FlatBuffers
This is a bit hacky way, you do it on your own risk 😉
One more time let’s go back to FlatBuffers documentation.
If your code is very performance sensitive (you iterate through a lot of objects), there’s a second pos() method to which you can pass a Vec3 object you’ve already created. This allows you to reuse it across many calls and reduce the amount of object allocation (and thus garbage collection) your program does.
Reuse it? Sounds familliar? Yeah, this is what ViewHolder pattern is used for.
Let’s see at ReposList.repos() method. There is repos(Repo obj, int j) version which gets already created Repo object and fill it with data from j position. Our optimized ViewHolder implementation could look like this one:
Repo objects are created only in ViewHolder initialization time. Then bindItemOnPosition() method reuse them. It means that we’ve just reduced Repo objects allocations from 83 to 2.
But still we stayed with 140 Strings allocations. Does FlatBuffers documentation save us this time?
Alternatively, use monster.nameAsByteBuffer() which returns a ByteBuffer referring to the UTF-8 data in the original ByteBuffer, which is much more efficient. The ByteBuffer’s position points to the first character, and its limit to just after the last.
How it can help us?
Quick look at TextView documentation and here it is - setText (char[] text, int start, int len) method which doesn’t require String object.
Whole implementation is bit tricky - we have to create char[] temporary arrays, fill them with data from FlatBuffer array (which is in byte type, so we have to cast it to char) and pass to TextView. Instead of describing it step by step here is important source code:
- OptimizedFlatRepositoriesListAdapter (see
FlatRepositoryViewHolder) - Repo - yes, unfortunatelly we had to update generated source code. But why not to ask FlatBuffers creators to provide us those methods in generated code in the future? Or fork this code and add it ourself? Look for
/*--- Added for ViewHolder ---*/comment to see what methods I wrote about (position of first char in string and string length)
Results
Allocations_FlatBuffers_List_Optimized.alloc - this file can be opened in Android Studio.
Allocation chart:
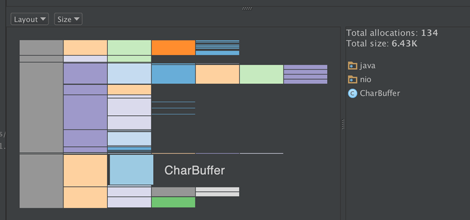
Memory allocated in measured time: 35.68K, total allocations: 543. It’s very close to 523 allocations in JSON ViewHolder
- CharBuffer: 6.43K (25.78%), 140 allocations
- String: no allocations
- frogermcs.io.flatbuffs.model.flat.* package: 2 allocations.
- char[]: 12 additional allocations made for our temporary arrays for name and description handling.
And it seems that we did it! FlatBuffers are almost the same effective as JSON parsed object in ListView scrolling. Yes, it’s still bit tricky, probably not yet production ready but it works.
Source code
Full source code of described project is available on Github repository. To compile it you have to download Android NDK package.
Author
Miroslaw Stanek
Head of Mobile Development @ Azimo Money Transfer
If you liked this post, you can share it with your followers or follow me on Twitter!