Dagger 2 - graph creation performance
#PerfMatters - recently very popular hashtag, especially in the Android world. The times when the apps just did something, no matter how, are already gone. Now everything should be pleasant, smooth and fast. For example Instagram spent almost half a year just to make its app faster, more beautiful, and more screen-size aware.
That’s why today I’d like to share with you short hint which can have a great impact on your app launch time (especially when it uses some external libraries).
Objects graph creation
In the most cases over the time of app development process, its launch time increases more or less. Sometimes it’s hard to notice in day-by-day development but when you compare your first app version with the most recent one you may find that the difference is relatively big.
And the reason may lay in a dagger objects graph creation process.
Dagger 2 you may ask? Exactly - even if you just moved your implementation from other reflection-based solutions, and your code is generated in a compile time don’t forget that object creation still happens in the runtime.
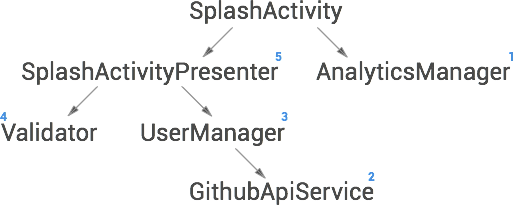
Objects (and its dependencies) are created at the first time when they are injected. Jake Wharton showed it clearly on this couple of slides of his presentation about Dagger 2:
And here is how it looks in our GithubClient example app:
- App is launched for the first time (of after it was killed). Application object has no
@Injectfields, so onlyAppComponentobject is created. - App creates
SplashActivity- it has two@Injectfields:AnalyticsManagerandSplashActivityPresenter. AnalyticsManagerdepends onApplicationobject which is already provided. So onlyAnalyticsManagerconstructor is called.SplashSctivityPresenterdependes on:SplashActivity,ValidatorandUserManager.SplashActivityis provided,ValidatorandUserManagershould be created.UserManagerdepends onGithubApiServicewhich also should be created. After itUserManageris created.- Now when we have all depedencies,
SplashSctivityPresenteris created.

Bit tangled, but in result, before SplashActivity will be created (let’s assume that object injection is the only operation which should be done in onCreate() method) we have to wait for construction (and optional configuration) of:
GithubApiService(it also uses some dependencies likeOkHttpClientanRestAdapter)UserManagerValidatorSplashActivityPresenterAnalyticsManager
created one after another.
Hey, but don’t worry, much richer graphs can be created almost instantly.
The problem
Now let’s imagine that we have to add external library which should be initialized with the app start (e.g. Crashlytics, Mixpanel, Google Analytics, Parse, etc.). Let’s imagine that that it’s our HeavyExternalLibrary and looks like this:
In short - constructor is empty and its call costs almost nothing. But then we have init() method which takes about 500ms and has to be called before we’ll be able to use this library. To be sure we call init() in a moment of object creation somewhere in our module:
Now our HeavyExternalLibrary becomes a part of SplashActivityPresenter:
And what happens? Our app launches about 500ms longer, just because of HeavyExternalLibrary initialization which has to be done in a process of creation SplashActivityPresenter dependencies graph.
Measurement
Android SDK (and Android Studio itself) gives us a tool for visualization of the application execution over time - Traceview. Thanks to this we can see how much time each method takes and find the bottlenecks, among others during the injection process.
Btw if you haven’t seen it before, take a look at Udi Cohen’s blog post about Android performance optimizations.
Traceview started directly from Android Studio (Android Monitor tab -> CPU -> Start/Stop Method Tracing) sometimes is not so precise, especially when we’re trying to hit “Start” at the moment of app launch.
Fortunately for us there is a method which can be used when we know the exact place in code which should be measured. Debug.startMethodTracing() can be used to point out the place in our code where measurement should be started. Debug.stopMethodTracing() stops tracing and creates new file.
For practice let’s measure our SplashActivity injection process:
setupActivityComponent() is called inside onCreate().
According to the documentation results are saved on /sdcard/SplashTrace.trace.
To pull them use this in your terminal:
$ adb pull /sdcard/SplashTrace.trace
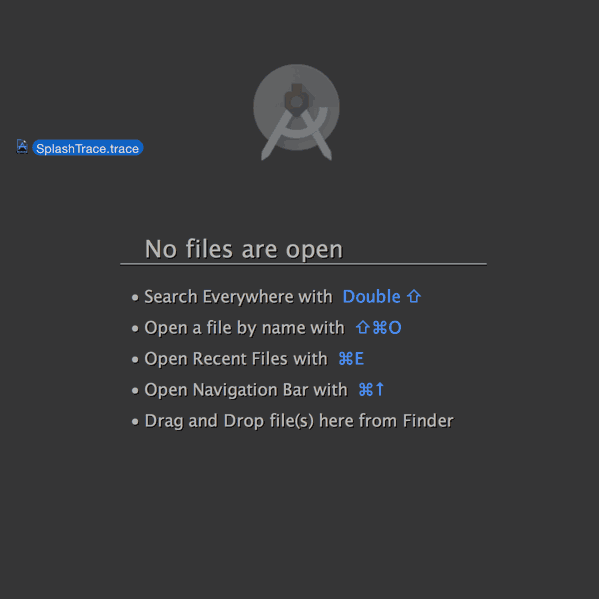
Now all you need to do to read this file is just to drag it into Android Studio:

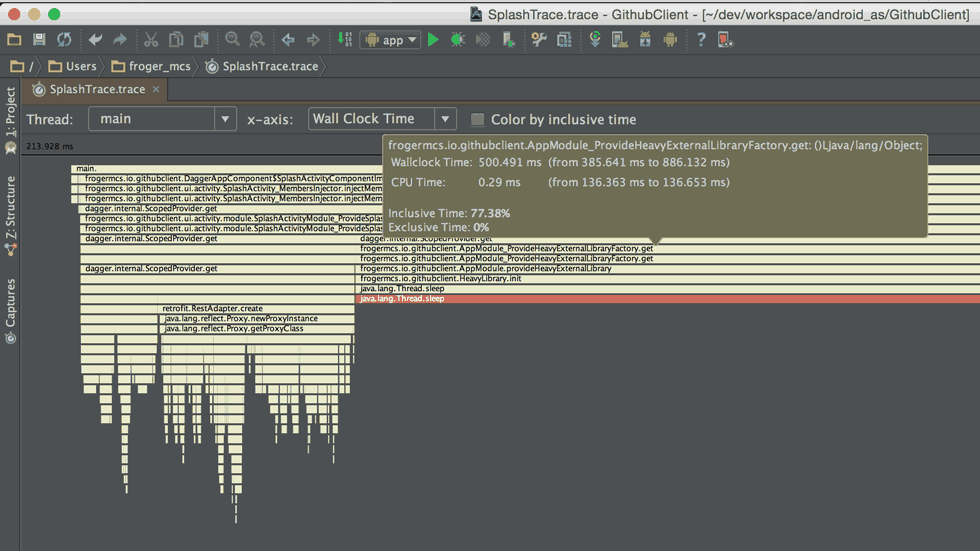
You should see something similar to this:

Of course results in this case are very clear: AppModule_ProvideHeavyExternalLibraryFactory.get() (place where our HeavyExternalLibrary is created) takes about 500ms.
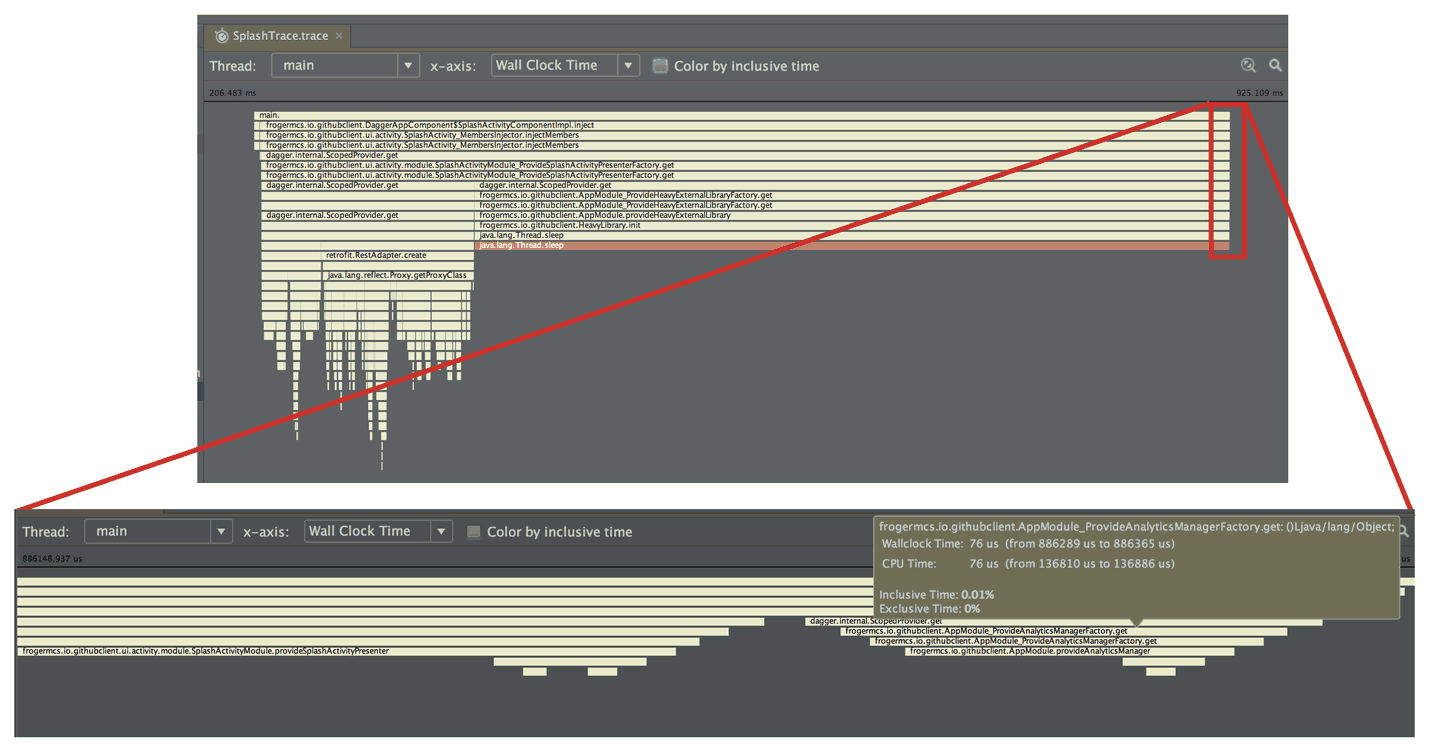
From pure curiosity let’s zoom a small piece of trace at the end:

Do you see the difference? Construction of our example class: AnalyticsManager takes less than 1ms.
In case you’d like to see it, here is SplashTrace.trace file used in this example.
Solution
Unfortunately sometimes there are no clear answers for this kind of performance issues. Here are two of them which helped me a lot:
Lazy loading (temporary solution)
Hint 2: Make use of #Dagger2 Lazy<> especially in dependencies initialised in Application but used later. #AndroidDev #perfmatters
— Miroslaw Stanek (@froger_mcs) September 22, 2015First of all let’s think if you need all of injected dependencies. Maybe some of them can be lazy-loaded bit time later? Of course it doesn’t solve the real problem (UI thread will be blocked in a moment of first calling Lazy<>.get() method). But in some cases it can help with launch time (especially where objects are used rarely). Check Lazy<> interface documentation for more details and code sample.
In short, every place where you use @Inject SomeClass someClass can be replaced with @Inject Lazy<SomeClass> someClassLazy (also in costructor injection). And to get the instance of someClass you have to call someClassLazy.get().
Async object creation
The second option (it’s still more the idea than the final solution) is to initialize object somewhere in a background thread and cache all methods calls and invoke them on the initialized object later.
Disadvantage of this solution is that it has to be prepared independently for all classes which we want to wrap. And it will work only with those objects which methods calls can be performed in the future (like any kind of analytics - it’s ok if some events will be logged bit later).
This is how this solution could look for our HeavyExternalLibrary:
When HeavyLibraryWrapper constructor is called library initialization takes place in a background thread (Schedulers.io() in this case). In the meantime, when user calls callMethod() it adds new subscription to our initialization process. When it’s done (onNext() method returns initialized HeavyExternalLibrary object) cached calls are passed to this object.
For now the idea is very simple and still under development. There is a possibility to cause memory leaks (e.g. what if we have to pass any argument in callMethod()), but in general ot works for the simplest cases.
Any other solutions?
Performance improvement process is very individual. But if you would like to share your ideas, please, just do it here.
Thanks for your reading!
Source code
Full source code of described project is available on Github repository.
Author
Miroslaw Stanek
Head of Mobile Development @ Azimo Money Transfer
If you liked this post, you can share it with your followers or follow me on Twitter!