FrameMetrics — realtime app smoothness tracking
A couple months ago, when Android Nougat was announced, among new features like Multi-window, enhanced notifications, VR support, 72 new emojis 👍 and others, there was a new addition to monitoring tools: Frame Metrics API.
On older Android versions when we would like to see graphic performance metrics we had to get them via adb shell, by calling:
$ adb shell dumpsys gfxinfo com.frogermcs.framemetrics
As a result we get:
These statistics are generated for last 120 frames for given application package (hint: this is not always last 2 seconds - frames are drawn only when Android is requested to do this e.g. when layout is changed or animated).
While this data can give us a lot of information about UI performance, accessing it from console isn’t the most convenient way, especially when we would like to use it during automatic app testing. Of course it isn’t impossible, and great example how it can be done is described in Automated Performance Testing Codelab (it’s implemented as a MonkeyRunner script).
FrameMetrics
Starting from Android SDK 24, we can have access to these informations directly from application code. There is no limit to the past 120 frames, because frame timing info for current app window is captured in realtime. Having direct access to this data means also that we are able to measure production app to know how it works on users’ devices.
FrameMetrics API documentation is pretty clear about what can be measured (chronologic order):
Metrics names are mostly self explaining but if this list looks not complete to you, take a look at FrameMetrics sources to see how each metric is calculated:
There are also great videos where Colt McAnlis explains among the others what VSYNC is or how layout is transformed to GPU commands (FrameMetrics.COMMAND_ISSUE_DURATION). So they also can shed some light on FrameMetrics fields:
Some FrameMetrics fields can be demystified by @duhroach videos: Rendering Performance on #AndroidDev https://t.co/LG3BUDK4Fs #PerfMatters
— Miroslaw Stanek (@froger_mcs) November 13, 2016
ActivityFrameMetrics
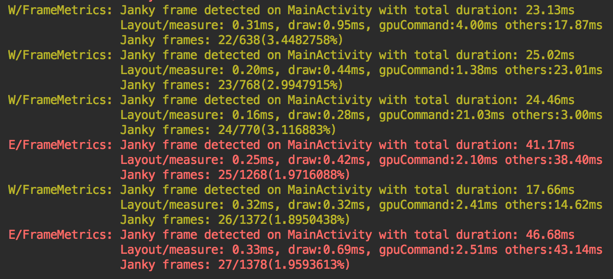
To make FrameMetrics even easier to use I created simple library called ActivityFrameMetrics. It is small 1-class library which prints janky frames warnings to Logcat:

Installation is pretty simple — you can copy ActivityFrameMetrics.java class to your project or use gradle dependency:
To use it, just register ActivityFrameMetrics as an ActivityLifecycleCallback in your Application class:
By default library prints Logcat warning for every frame which rendering took more than 17ms, and error for more than 34ms.
Default values can be changed with ActivityFrameMetrics.Builder params:
Repo for ActivityFrameMetrics library can be found on Github.
Digging deeper into FrameMetrics
If it’s still not enough and you are still curious how FrameMetrics works under the hood here are a couple hints where you could start searching.
First of all FrameMetrics is just a simple data container written in java but nothing really is measured in it. Instead this data comes as a notification from C++ code which is responsible for view rendering. Good starting point could be ThreadedRenderer class which proxies rendering to render thread. If you explore C++ code a bit more, at the end probably you’ll find JankTracker class which is responsible for filling up FrameMetrics data (and you will realise that this is exactly the same data which is presented in dumpsys gfxinfo) and FrameInfo class which is C++ data container which is in sync with FrameMetrics.java.
What else you can find there is only up to you. Just never stop searching and always be curious.
Thanks for reading!
Author
Miroslaw Stanek
Head of Mobile Development @ Azimo Money Transfer
If you liked this post, you can share it with your followers or follow me on Twitter!