
AndroidDevMetrics - dagger2metrics evolved into metrics for Android development
Dagger2Metrics was a good start to help us look for performance issues in Android apps which we develop. It shows us how much time is needed to initialize particular objects (and their dependencies) in graph, in Dagger 2. But there are much more things to measure than just an object initializations. And it’s the reason why I’ve decided to make this tool a part of something bigger. Let me introduce an evolution of dagger2metrics:
AndroidDevMetrics
Performance metrics library for Android development.
The problem with performance is that it often decreases slowly so in day-by-day development it’s hard to notice that our app (or Activity or any other view) launches 50ms longer. And another 150ms longer, and another 100ms…
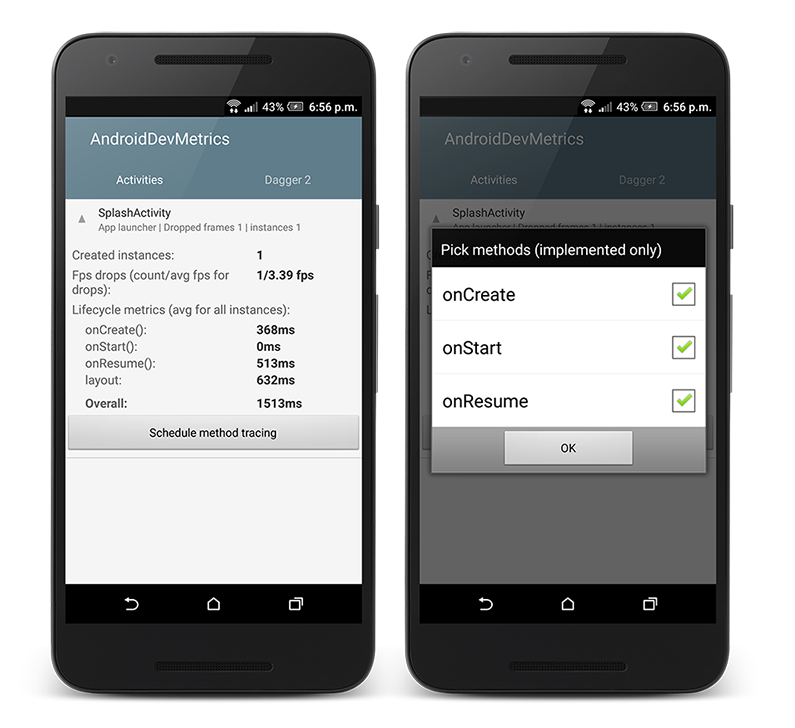
With AndroidDevMetrics you will be able to see how performant are the most common operations like object initialization (in Dagger 2 graph), or Activity lifecycle methods (onCreate(), onStart(), onResume()).
It won’t show you exact reason of performance issues or bottlenecks (yet!) but it can point out where you should start looking first.
AndroidDevMetrics currently includes:
- Activity lifecycle metrics - metrics for lifecycle methods execution (
onCreate(),onStart(),onResume()) - Frame rate drops - metrics for fps drops for each of screens (activity)
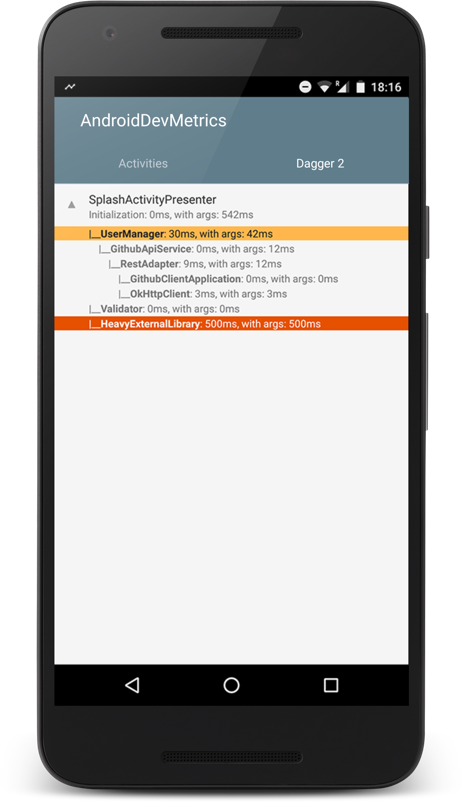
- Dagger 2 metrics - metrics for objects initialization in Dagger 2
Getting started
Script below shows how to enable all available metrics.
In your build.gradle:
In your Application class:
How does it work?
Detailed description how it works under the hood can be found on wiki pages:
I found performance issue, what should I do next?
There is no silver bullet for performance issues but here are a couple steps which can help you with potential bugs hunting.
If measured time of object initialization or method execution looks suspicious you should definitely give a try to TraceView. This tool logs method execution over time and shows execution data, per-thread timelines, and call stacks. Practical example of TraceView usage can be found in this blog post: Measuring Dagger 2 graph creation performance.
If it seems that layout or view can be a reason of performance issue you should start with those links from official Android documentation:
Finally, if you want to understand where most of performance issues come from, here is a collection of videos focused entirely on helping developers write faster, more performant Android Applications.
Example app
You can check GithubClient - example Android app which shows how to use Dagger 2. Most recent version uses AndroidDevMetrics for measuring performance.
Source code
Source code of AndroidDevMetrics is available on Github project site.
Author
Miroslaw Stanek
Head of Mobile Development @ Azimo Money Transfer
If you liked this post, you can share it with your followers or follow me on Twitter!